Six more orders. A clearer look at what the product does.
Luma Desk Co. paired practical product demonstrations with automatic Celebian views and likes, while giving shoppers an easier route from TikTok to the right product.
Eight-week programme · 6 July–30 August 2026
Orders completed in tagged TikTok sessions
12 → 18
1–28 June 2026
vs 3–30 August 2026
- TikTok-linked orders
- +6
- 12 → 18 per 28 days
- Tagged store sessions
- +30%
- 400 → 520 per 28 days
- Product videos published
- 24
- Three a week for eight weeks



Luma Desk Co.
Inês Vale · Lisbon, Portugal · Co-founder of Luma Desk Co. · TikTok and online store

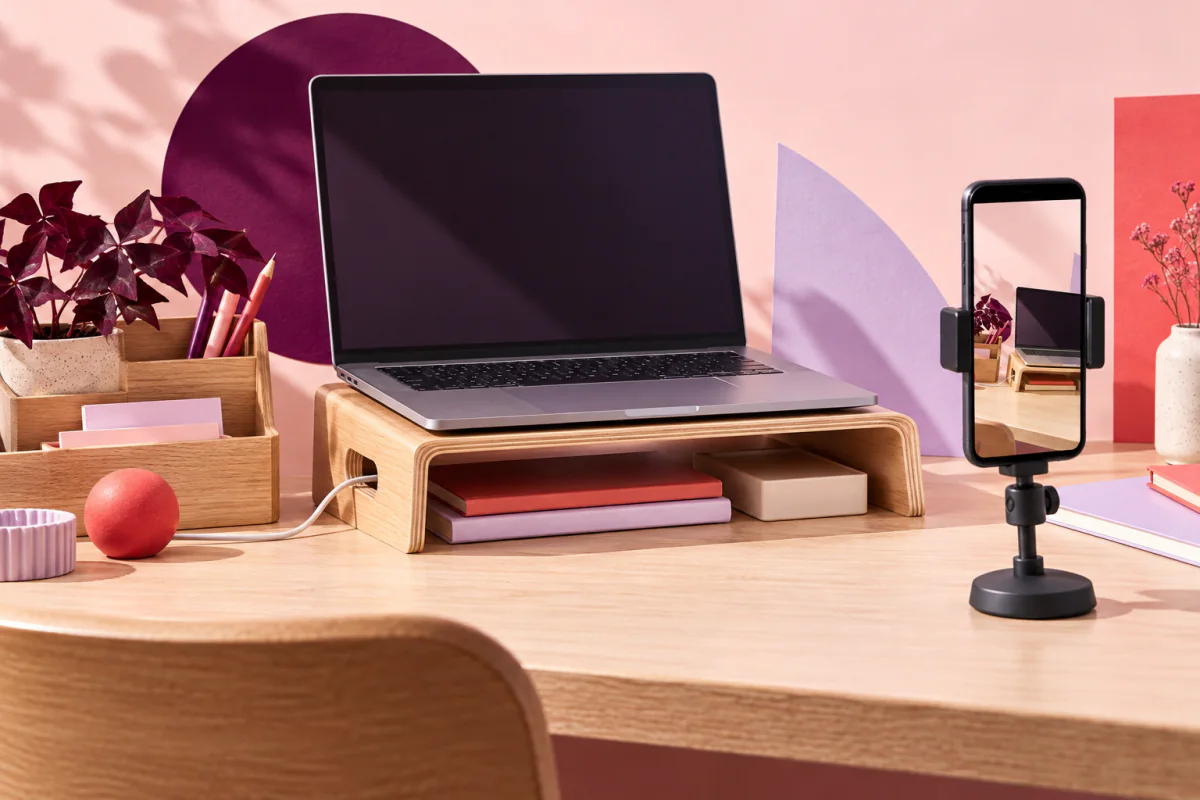
Luma Desk Co. finished its eight-week plan with 18 store orders linked to TikTok in the final 28 days, compared with 12 in the baseline period. Tagged store sessions rose from 400 to 520. For a three-person business making desk organisers and laptop stands, six additional orders were a useful step forward.
The team published three videos a week and used Celebian’s automatic services for all 24 uploads: 1,000 views and 100 likes per post. Alongside that setup, it made each video more practical and changed the bio link to a collection containing the products being demonstrated.
The order figures describe the shop’s tagged TikTok traffic. They do not show which visitors encountered purchased engagement, or how many orders Celebian caused. The content changes and simpler shopping route are part of the same story.
The product looked good but left questions unanswered
Inês and two colleagues handled product design, packing and customer service. Their TikTok account was nine months old, with 2,650 followers at the start of the programme. They already posted three times a week, usually attractive desk montages set to music.
Those clips rarely showed dimensions, cable space or how a stand worked on a small desk. The team wanted a repeatable engagement routine and more visits from people who understood the product before reaching the store.
The results
1–28 June 2026 vs 3–30 August 2026
Orders completed in tagged TikTok sessions
+6
- Baseline
- 12 orders
- Comparison
- 18 orders
Tagged store sessions
+30%
- Baseline
- 400 sessions
- Comparison
- 520 sessions
Show the problem and the product in the same frame
The weekly plan stayed simple: one desk reset, one demonstration of a single feature and one answer to a customer question. Clips lasted 15–30 seconds. The team filmed hands using the products on real desks, with English captions for its European audience.
Instead of opening with the logo, a video began with the problem: a charging cable falling behind a desk or a laptop occupying the whole work surface. Dimensions appeared on screen. The closing caption pointed viewers to the featured-products collection.
A 90-minute filming session produced the week’s three uploads. Inês reviewed questions twice a day and turned recurring ones into the next demonstration. Automatic likes and views ran on every new post during the eight weeks, so the team did not place separate manual orders for each upload.
Three videos. Automatic on every upload.
6 July–30 August 2026
-
Week 1
3 videos
3,000 views
300 likes
-
Week 2
3 videos
3,000 views
300 likes
-
Week 3
3 videos
3,000 views
300 likes
-
Week 4
3 videos
3,000 views
300 likes
-
Week 5
3 videos
3,000 views
300 likes
-
Week 6
3 videos
3,000 views
300 likes
-
Week 7
3 videos
3,000 views
300 likes
-
Week 8
3 videos
3,000 views
300 likes
Weeks 5–8: 3–30 August 2026
Automatic TikTok views
24,000
1,000 per order or post × 24
Automatic TikTok likes
2,400
100 per order or post × 24
What they used
A defined purchase routine across 6 July–30 August 2026.
| Service | Quantity × orders or posts | Programme total | Routine and purpose |
|---|---|---|---|
| Automatic TikTok views | 1,000per post × 24posts | 24,000 views | Every upload; 3 a week for 8 weeks
24,000 purchased views across the programme; billed per qualifying upload. |
| Automatic TikTok likes | 100per post × 24posts | 2,400 likes | Every upload; 3 a week for 8 weeks
2,400 purchased likes across the programme; billed per qualifying upload. |
 Automatic TikTok views
 Automatic TikTok likes
The eight-week plan
-
Weeks 1 and 2
Enable both automatic services and replace the generic bio destination with the featured-products collection.
-
Weeks 3 and 4
Film demonstrations around dimensions, cable storage and small desks. Keep the three-post schedule.
-
Weeks 5 to 8
Repeat the useful demonstrations and compare tagged store sessions with completed orders. Leave package sizes unchanged.
“The automatic orders took a repetitive task off our list. The videos still had to answer the questions someone would ask before buying.”
 Inês ValeLuma Desk Co.
Product clarity matters after the click
The tagged-session order rate moved from 3.00% to 3.46%. That is a 0.46 percentage-point change, based on just 12 and 18 orders. It is an encouraging descriptive result, with too few orders and too many simultaneous changes to establish a reliable conversion effect.
Celebian supplied the planned views and likes automatically. The demonstrations gave shoppers product information, and the new collection link made the next step easier. A slow packing montage received the same purchased quantities but prompted little useful discussion. The team kept its buying settings and changed what it filmed.
How the results were measured
Headline changes compare 1–28 June with 3–30 August 2026. The programme lasts eight weeks, 6 July–30 August. Post-level measures use each video’s first seven days; data are locked on 6 September. The week before the programme allows baseline posts to complete that observation window.
Six additional orders means 18 − 12. Sessions rise by (520 − 400) ÷ 400 = 30%. The headline uses the absolute order increase because the baseline is small.
Explore the comparison figures and measurement notes
| Metric and definition | 1–28 June 2026 | 3–30 August 2026 | Change |
|---|---|---|---|
| Orders completed in tagged TikTok sessions (orders) Unique non-cancelled orders completed within a session arriving through the TikTok bio UTM link. Same-session attribution only; finalised seven days after the period ends. |
12 | 18 | +6 orders |
| Tagged store sessions (sessions) Sessions starting from the tagged TikTok bio link; repeat visits can create separate sessions. |
400 | 520 | +120 sessions |
| Total video views (views) Period account totals. Final window includes 12,000 purchased views on 12 uploads; baseline has no purchased engagement. |
28,000 | 44,000 | +16,000 views |
| Tagged-session order rate 12 ÷ 400 versus 18 ÷ 520. Rounded display 3.00% → 3.46%; +0.46 percentage points. No significance or causal claim. |
3.00% | 3.46% | +0.46 percentage points |
What to keep in mind
- The 24,000 purchased views and 2,400 purchased likes cover all eight weeks. Half fall in the final 28-day comparison: 12,000 views and 1,200 likes across 12 uploads. Automatic services remain enabled for every programme upload.
- The 44,000 final-period views include those 12,000 purchased views. Subtracting bought units does not identify the number of unique organic viewers or estimate incremental reach.
- No TikTok Ads, influencer placements, giveaways or other engagement purchases. Prices, stock availability and delivery terms are unchanged. Product demonstrations, comment replies and the bio destination change together.
Make room for the next useful video
Build a posting routine your team can maintain. Explore automatic views if you want an engagement setup that follows each new upload, with charges tied to the posts you publish.
Explore automatic TikTok views